목차
Detect correlation between morpheme in articles and real epidemic data
Definition
Project Overview
The plague has taken the lives of many people, and at the moment, many diseases are potentially spreading. People are infected by a variety of causes, such as air, insects, animals, and water. However, since ordinary people don't know when, where and how epidemics start or disappear, so, they are very ignorant about the epidemic. the most people recognizes large and powerful epidemics only through news, articles and government announcements. Therefore, little known or small infectious diseases remains unnoticed to the public.
In this project, we analyze the frequency of words related illness in the articles and the relationship between the occurrence of actual diseases and find the actual diseases that have occurred and disappear.
Problem Statement
The purpose is to find the relationship between the frequency of disease-related words in the contents of articles and the presence or absence of actual diseases within that range of dates (2015, 2016, 2017). The tasks are as follows:
- Collect news articles in NAVER. (https://news.naver.com/) (=news articles have been collected since May 20, 2015.)
- Analyze morphemes of every news article by a year term and calculate the average frequency of how many times the term 'patient’ has been used in article. (Why we chose ‘patients’? : when we looked at morphological analysis in the sample group extracted from the population, the most frequent morpheme except the pathologic name was high.)
- After analyzing all of the news articles morphemes by a monthly basis, select the months that have higher frequency of using the term ‘patients’ in the news compared to the average number.
- Based on the analyzed morphemes of the selected month, check the occurrence of an epidemic in that day using the actual data from KOSIS(Korean Statistical Information Service).
Analysis
Data Exploration
Collected articles data are all the news articles from various portals that have been collected since 2015. Using Python library web crawler called ‘Scrapy’, we define the fields of the data to be collected( item.py )and write code to get the information (spider.py). The crawled web article data was stored in a personal DB. Data is about 500,000 total, and we use article content and collection time in this data. The collection article data has the following fields:
- id : Collected article Index ( Integer )
- aid: article identified number(Integer)
- title : article title(String)
- content : article content(String)
- aDate : collected time (TimeStamp)
- nUrl : article url from NAVER (String)
- pUrl : article url from original NEWS site (String)
- nClass : article section (String)
- press : article company (String)
- subclass, pdf, numComment etc.
Data Visualization
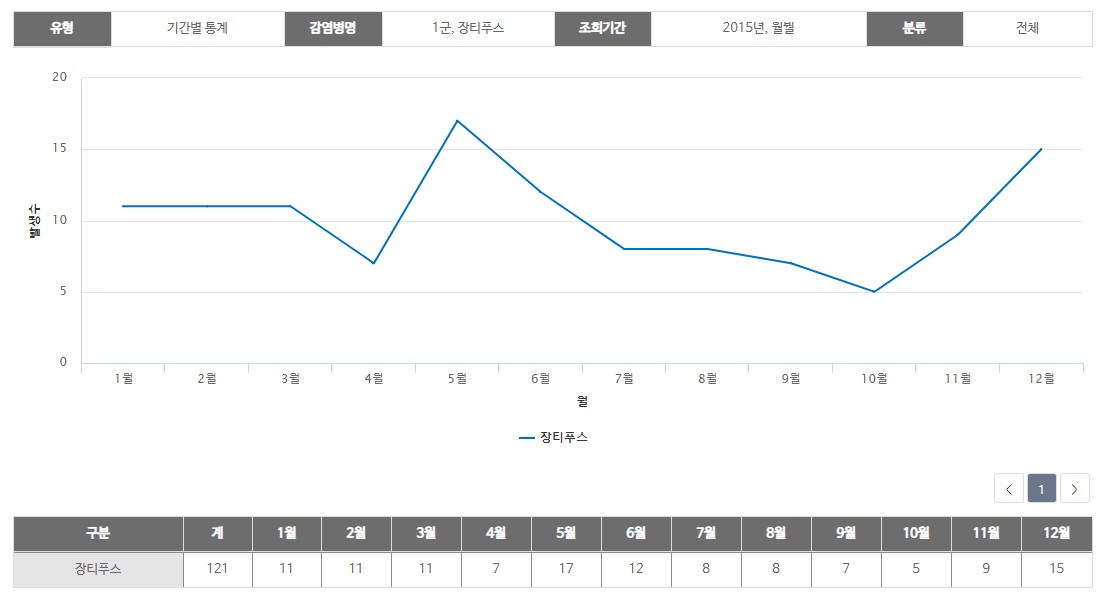
This graph is the monthly patients number of typhoid fever in a certain year. Similary, the number of incidents for each year /month of Group 1to 4 infectious diseases can be confirmed. These data are uses as a basis for comparing the correspondence between the data analyzed by us and the actual data.
<source> Infection portals : http://www.cdc.go.kr
Methodology
Data Preprocessing
Article collection data is supplied and has 100% accuracy. So, no preprocessing is required.
Implementation
Analyze all the news articles on a yearly basis and calculate the average by calculating the frequency of the term ‘patient’.
def get_tag(text, ntags):
    spliter = Okt()
    nouns = spliter.nouns(text)

    count = Counter(nouns)
    return_list = []

    for n, c in count.most_common(ntags):
        if (n == "환자"):
            temp = {'tag': n, 'count': c}
            return_list.append(temp)
    return return_list
import time
start_time = time.time()

noun_list = []
count_list = []

for i in range(1, 13):
    article_df_month = article_df.loc[(article_df['aDate'].dt.month == i)]

    noun_count = 1000
    tags = get_tag(article_df_month.to_string(), noun_count)

    for tag in tags:
        noun = tag['tag']
        count = tag['count']
        print(str(i) + "월")
        print(noun, ":", count)
        noun_list.append(str(i))
        count_list.append(count)
patient_df = pd.DataFrame({"Month" : noun_list, "Patient" : count_list})
total = patient_df.sum(axis = 0)[1]
month_avr = total / 12
print("Month Average :", month_avr)

select_month = patient_df[patient_df['Patient'] > month_avr]
Month Average : 2331.6371681415926
-Higher frequency Months than Average-
| index | Month | Patient |
|---|---|---|
| 0 | 5 | 2899 |
| 1 | 6 | 10629 |
select the months that have higher frequency of using the term ‘patients’ and show a list of morphemes for that month.
def get_tags(text, ntags):
    spliter = Okt()
    nouns = spliter.nouns(text)

    count = Counter(nouns)
    return_list = []

    for n, c in count.most_common(ntags):
        temp = {'tag': n, 'count': c}
        return_list.append(temp)

    return return_list
for i in range(select_month.shape[0]):
    month = select_month['Month'][i]

    article_df_month = article_df.loc[(article_df['aDate'].dt.month == int(month))]

    noun_count = 10
    tags = get_tags(article_df_month.to_string(), noun_count)

    print(str(month) + "월")
    for tag in tags:
        noun = tag['tag']
        count = tag['count']
        print(noun, ":", count)
# month_avr : The average of the frequencyofthe 'patient’ morphemes per month calculated as “ the number of 'patient’ morphemes / day *30 “ because of the data from May 20 to December 31 for 2015.
# select_month : The frequency of ‘patient’ morphemes is higher than average
Based on the analyzed morphemes of the selected month, check the occurrence of an epidemic in that day using the actual data from KOSIS.
mers_df = pd.read_csv("MERS.csv")

patient_df['Month'] = patient_df['Month'].astype(int)
mers_df['Month'] = mers_df['Month'].astype(int)
merge_2015 = pd.merge(patient_df, mers_df)
merge_2015.corr()
Refinemnet
get_tag() : A function that returns the frequency of the 'patient’ morpheme as a list using konlpy's Okt and extracts nouns with nouns() and figures out frequency with Counter object.
@param1 : Text to analyze morpheme
@param2 : The number of nouns to be extracted with high frequency
get_tags() : A function that returns a list of n morphemes with a high frequency and prints them.
@param1 : Text to analyze morpheme
@param2 : The number of nouns to be extracted with high frequency
Result
Model Evaluation and Validation
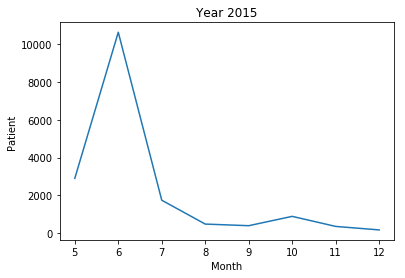
<2015>
- The frequency of 'patient' morpheme among articles of each month
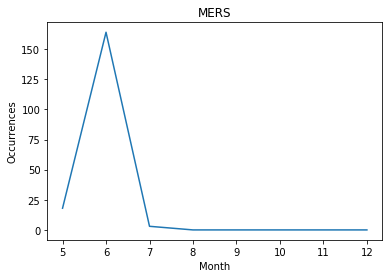
- Real data on patients that actually occurred 'MERS'
- Correlation between 'patient' morphological frequency and 'MERS' patient number
| Month | Patient | Occurrences | |
|---|---|---|---|
| Month | 1.000000 | -0.603977 | -0.486350 |
| Patient | -0.603977 | 1.000000 | 0.985725 |
| Occurrences | -0.486350 | 0.985725 | 1.000000 |
<2016>
- The frequency of 'patient' morpheme among articles of each month
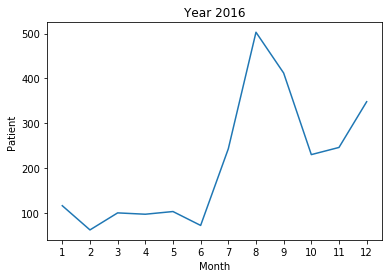
- Real data on patients that actually occurred all infectious disease
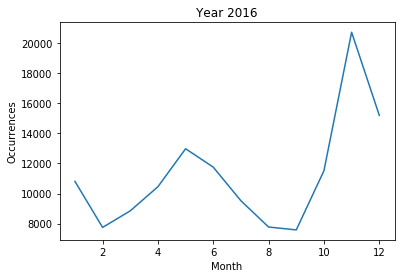
- Correlation between 'patient' morphological frequency and all epidemic patient number
| Month | Patient | Occurrences | |
|---|---|---|---|
| Month | 1.000000 | 0.696169 | 0.507285 |
| Patient | 0.696169 | 1.000000 | -0.043851 |
| Occurrences | 0.507285 | -0.043851 | 1.000000 |
<2017>
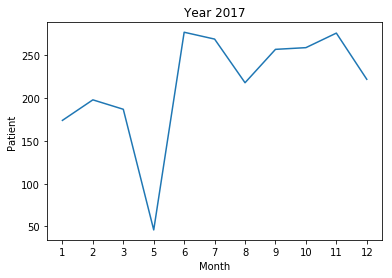
- The frequency of 'patient' morpheme among articles of each month
- Real data on patients that actually occurred all infectious disease
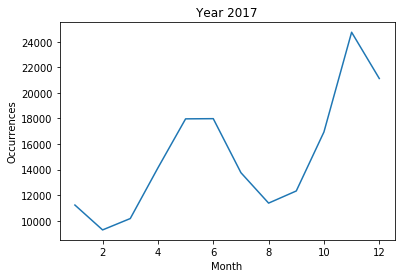
- Correlation between 'patient' morphological frequency and all epidemic patient number
| Month | Patient | Occurrences | |
|---|---|---|---|
| Month | 1.000000 | 0.490746 | 0.703117 |
| Patient | 0.490746 | 1.000000 | 0.179343 |
| Occurrences | 0.703117 | 0.179343 | 1.000000 |
Justification
- 2015 year : The news article written in June showed the most abundant usage of the morpheme ‘patient’. And it was actually the same month as when there were highest number of MERS patients among the globe.
In addition, in 2015, the usage frequency of the morpheme ‘patient’ did have a very strong positive correlation to the number of patients that actually suffered from disease, which was up to 0.985725.
- 2016 year : The 'patient’ morpheme did not have a high frequency as a whole, and the correlation between the frequency and the total number of infected persons was -0.043851.
In fact, in 2016, there was no national disaster caused by a pandemic.
- 2017 year : The frequencies of the “patient” morphemes were equally low evenly. The correlation between frequency and number of infections is 0.179343, which is considered to be weak.
In 2017, there is no national disaster caused by a contagious disease. Although the frequency of “patient” morphemes is not sufficient to identify common infectious diseases, it seems possible to understand the state of calamity caused by a pandemic.
Conclusion
Reflection
In 2015 and 2017, there is a strong positive correlation between the frequency of morpheme “patient” in the article and the actual number of infectious diseases, whereas in 2016 it is seen as having a negative correlation.
Improvement
- It was a very weak criterion because there was only a 'patient’ morpheme to compare with actual data. We need to add more and clear and empowering edges.
- And, since we analyze the morpheme with only contents of all articles regardless of field. Therefore, at that time, when there were many social and political issues, there were very few articles and morphemes related to 'infectious diseases'.
- In the future, I would like to reconsider the logic of proving that particular morphemes of article and another edges are associated with the actual data.

